Configuring Range Slider Controls
Overview
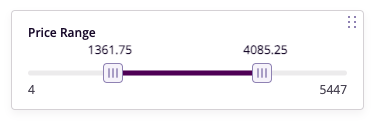
Range Slider Controls enable dynamic filtering of numerical data by setting minimum and maximum values. This powerful tool helps refine datasets and improve the granularity of analysis in your reports.
Getting Started
Before configuring a Range Slider Control, ensure you have:
- A dataset with numerical fields
- Clear understanding of value ranges
- Charts that will benefit from range filtering
Business Value
- Enable precise data filtering
- Improve analysis granularity
- Support interactive exploration
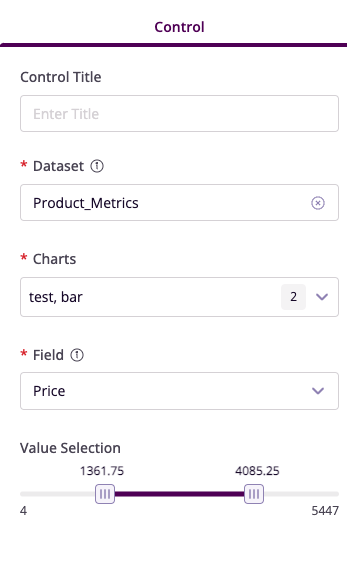
Control Configuration
Basic Configuration
- Control Title: Set descriptive name
- Dataset: Select data source
- Charts: Choose affected visualizations
- Field: Select numerical column
Range Settings
- Minimum Value: Set lower bound
- Maximum Value: Set upper bound
- Step Size: Define increment
- Default Range: Set initial values
Advanced Features
Chart Integration
- Select target charts
- Configure update behavior
- Set refresh triggers
Value Formatting
- Number formatting
- Unit display
- Decimal precision
Example Use Cases
Price Range Analysis
- Control Title: Price Range Filter
- Field: Product Price
- Range: $100 - $1000
- Purpose: Product performance analysis
Sales Volume Filtering
- Control Title: Sales Volume Range
- Field: Units Sold
- Range: 500 - 5000
- Purpose: Volume-based analysis
Best Practices
Range Configuration
- Set appropriate min/max values
- Consider data distribution
- Use logical step sizes
Visual Presentation
- Clear range indicators
- Intuitive slider movement
- Responsive updates
Performance Optimization
- Efficient range updates
- Smooth chart refreshes
- Optimal value steps